Backtesting Iron Condors: What the Data Actually Shows About Long-Term Performance
Backtesting Iron Condors: What the Data Actually Shows About Long-Term Performance Backtesting Iron Condors: What the Data Actually Shows About Long-Term Performance In the dynamic world of options trading, strategies like the iron condor are often lauded for their potential to g
Abstract
Backtesting Iron Condors: What the Data Actually Shows About Long-Term Performance Backtesting Iron Condors: What the Data Actually Shows About Long-Term Performance In the dynamic world of options trading, strategies like the iron condor are often lauded for their potential to g
Backtesting Iron Condors: What the Data Actually Shows About Long-Term Performance
In the dynamic world of options trading, strategies like the iron condor are often lauded for their potential to generate consistent income through time decay (theta). However, anecdotal evidence and theoretical discussions often fall short of providing a truly robust understanding of a strategy's long-term viability. At Volatility Anomaly, we believe in data-driven decision-making. This article delves deep into the often-overlooked realm of iron condor backtest results, dissecting historical performance across various market regimes to uncover what the data actually shows. Is the iron condor the consistent income generator many perceive it to be, or are there hidden pitfalls that only extensive options backtesting can reveal?
Our comprehensive analysis will explore critical metrics such as win rates, average returns, and maximum drawdowns, providing a transparent view of the strategy's historical behavior. We'll examine how factors like implied volatility (IV), VIX levels, and specific delta selections influence outcomes. By the end of this deep dive, you'll have a much clearer, data-backed perspective on the iron condor historical performance, equipping you with actionable insights to refine your trading approach and enhance your risk management protocols. Prepare to challenge conventional wisdom and embrace a data-centric view of this popular options strategy.
Background & Context: Why Backtesting Iron Condors Matters Now
The appeal of the iron condor is undeniable: a defined-risk strategy designed to profit from a stock or index staying within a specific price range, capitalizing on the relentless march of time decay. In periods of low volatility and sideways markets, iron condors can appear to be a low-stress, high-probability trade. Yet, market conditions are rarely static. We've witnessed unprecedented volatility spikes in recent years, from the COVID-19 pandemic shock in early 2020 to the inflation-driven uncertainty of 2022 and the subsequent tech rally of 2023. These shifts underscore a critical need for traders to understand how their strategies perform not just in ideal conditions, but across the full spectrum of market environments.
Traditional options education often focuses on the theoretical mechanics of the iron condor, illustrating its profit and loss profile. While foundational, this approach lacks the empirical evidence necessary for robust decision-making. How does a 1-standard deviation iron condor (roughly 16-delta wings) fare when the VIX suddenly spikes from 15 to 30? What happens to a 45-day expiration iron condor on SPY if the market experiences a 5% move in a single week? Without rigorous options backtesting, these questions remain speculative.
Furthermore, the rise of retail trading and readily available options data has led to an explosion of interest in income-generating strategies. However, the ease of entry into options trading can mask the complexities of consistent profitability. Many traders jump into strategies like the iron condor without fully appreciating the nuances of position sizing, management, and the impact of tail risk. This is where a comprehensive iron condor backtest becomes indispensable. It allows us to move beyond intuition and validate assumptions with hard data, revealing the true profitability and risk characteristics of the strategy over extended periods. Our goal at Volatility Anomaly is to equip you with this data, enabling you to make informed decisions that align with your risk tolerance and financial objectives.
Core Concept Deep Dive: Dissecting Iron Condor Performance Metrics
To truly understand the iron condor historical performance, we must go beyond simple win/loss ratios. Our backtesting methodology focuses on a holistic set of metrics that provide a nuanced view of the strategy's behavior. We typically simulate trades on liquid underlying assets like SPY, QQQ, and sometimes high-volume individual stocks such as AAPL, using historical options data spanning over a decade (e.g., 2007-2023) to capture diverse market conditions, including bull markets, bear markets, and periods of high and low volatility.
Key Backtesting Parameters & Assumptions:
- Underlying Assets: Primarily broad market ETFs like SPY (S&P 500) and QQQ (Nasdaq 100) due to their liquidity and representativeness of market direction.
- Expiration Cycle: Typically 30-60 days to expiration (DTE), with a sweet spot often found around 45 DTE to balance theta decay and gamma risk.
- Delta Selection: This is crucial. We often test various delta ranges for the short strikes, such as:
- Conservative: 0.10-0.15 delta (e.g., 10-delta short puts and calls)
- Moderate: 0.15-0.20 delta (e.g., 16-delta short puts and calls, approximating one standard deviation)
- Aggressive: 0.20-0.25 delta (e.g., 20-delta short puts and calls)
- Spread Width: Consistent spread widths, often $5 or $10 for SPY/QQQ, to standardize risk and reward profiles. For example, a $5 wide spread means a $500 maximum loss per contract.
- Entry Conditions:
- IV Rank (IVR): Often a critical filter. We might initiate trades when IVR is above 30% or 50% to capitalize on potentially inflated premiums. For instance, entering an iron condor on SPY when its 52-week IVR is at 60% suggests options are relatively expensive, favoring premium sellers.
- VIX Level: While related to IVR, VIX provides a broader market volatility context. We might test entries when VIX is above 20 or 25, indicating higher overall market uncertainty and thus higher premiums.
- Exit Conditions & Management:
- Profit Target: Typically 25% to 50% of maximum profit. For a $10 wide spread collecting $2.00 in premium, a 25% profit target would be closing for $1.50 (realizing $0.50 profit).
- Stop Loss: Critical for risk management. Often set at 1x or 2x the credit received. For example, if $1.00 credit is received, a stop loss might be to close the trade if the loss exceeds $1.00 or $2.00. Alternatively, a delta-based stop (e.g., if the short strike delta exceeds 0.40) can be used.
- Rolling: Some backtests include rolling strategies (e.g., rolling out in time, or rolling the unchallenged side closer) to defend positions, but for simplicity and clarity, initial backtests often exclude complex rolling to isolate core strategy performance.
- Expiration Management: Close positions a few days before expiration (e.g., 5 DTE) to avoid gamma risk.
What the Data Reveals – General Trends:
- Win Rate vs. Profitability: Iron condors often boast high theoretical win rates (e.g., 70-80% for 16-delta wings). However, backtests frequently show that a high win rate does not automatically translate to high overall profitability. A few large losses can wipe out many small wins. For example, a strategy with an 80% win rate and an average win of $50 but an average loss of $500 will quickly deplete capital.
- Impact of IV Rank: Entering iron condors when IVR is high (e.g., >50%) tends to yield better results. Higher IV means higher premiums collected, providing a larger buffer against adverse moves. Our backtests on SPY often show that iron condors initiated with SPY's IVR above 60% have significantly better risk-adjusted returns than those initiated below 30% IVR.
- Delta Selection & Risk:
- Conservative (10-15 delta): Higher win rates (often >80%) but lower average premium collected, leading to smaller profits and a greater sensitivity to tail risk (a single large move can be devastating relative to the small credits).
- Moderate (16-20 delta): A balance between premium collection and win rate. This range often performs best on a risk-adjusted basis, especially with robust stop-loss mechanisms.
- Aggressive (20-25 delta): Higher premium collection, but significantly lower win rates and increased exposure to smaller market movements. These often require more active management.
- Market Regimes:
- Bull/Sideways Markets (Low VIX): Iron condors can perform well, grinding out consistent small profits.
- Bear Markets/High Volatility (High VIX): This is where iron condors struggle significantly. Sudden, sharp moves can breach both wings quickly. While premiums are higher, the increased probability of a large directional move often outweighs the benefit. Backtests during periods like Q4 2018 or Q1 2020 show substantial drawdowns for unmanaged iron condors.
- Average Return on Capital (ROC): Backtests often show average ROC per trade ranging from 2% to 8% for a 45 DTE iron condor, depending on the parameters. However, the annualized ROC can vary wildly based on position sizing, frequency of trades, and managing losing positions.
- Maximum Drawdown: This is a critical metric. Even strategies with positive overall returns can have significant drawdowns. For iron condors, drawdowns of 20-30% of capital are not uncommon in unmanaged or poorly managed backtests, particularly during periods of high market stress.
In essence, the data suggests that while iron condors can be profitable, they are far from a "set it and forget it" strategy. Success hinges on precise entry conditions (especially IVR), disciplined risk management, and an understanding of how market regimes impact performance.
Practical Application: A Backtested Example on SPY
Let's walk through a simplified, backtested example of an iron condor strategy on SPY, applying some of the parameters discussed. This example will highlight entry, management, and exit conditions based on historical data.
Strategy Parameters for SPY Iron Condor:
- Underlying: SPY (S&P 500 ETF)
- Expiration: ~45 Days to Expiration (DTE)
- Short Strikes Delta: Approximately 0.16 delta for both put and call sides (roughly 1 standard deviation out)
- Spread Width: $10 wide (e.g., short 400 put, long 390 put; short 450 call, long 460 call)
- Entry Condition: SPY's 52-week IV Rank (IVR) > 50% AND VIX > 20.
- Profit Target: Close at 50% of maximum profit.
- Stop Loss: Close if the total loss on the position exceeds 1.5x the initial credit received. Alternatively, if either short strike delta reaches 0.40.
- Exit Before Expiration: Close all positions 7 DTE to avoid gamma risk.
Worked Example: SPY Iron Condor in Q3 2022
Let's consider a period of elevated volatility in late summer/early fall 2022, a challenging environment for many premium sellers.
Trade Entry: August 22, 2022
- Market Context: SPY was trading around $420. VIX was at 20.5 (meeting our >20 condition). SPY's 52-week IVR was approximately 65% (meeting our >50% condition). This signals a good environment for premium selling.
- Expiration: We target the October 7, 2022 expiration cycle (46 DTE).
- Strike Selection:
- Short Put: SPY 400 Put (approx. 0.16 delta)
- Long Put: SPY 390 Put
- Short Call: SPY 440 Call (approx. 0.16 delta)
- Long Call: SPY 450 Call
- Premium Collected:
- Sell SPY Oct 7 400 Put @ $2.50
- Buy SPY Oct 7 390 Put @ $1.80
- Sell SPY Oct 7 440 Call @ $2.20
- Buy SPY Oct 7 450 Call @ $1.50
- Net Credit Received: ($2.50 - $1.80) + ($2.20 - $1.50) = $0.70 + $0.70 = $1.40.
- Maximum Profit: $140 per contract.
- Maximum Loss: ($10.00 spread width - $1.40 credit) = $8.60, or $860 per contract.
- Breakeven Points: $400 - $1.40 = $398.60 (put side); $440 + $1.40 = $441.40 (call side).
- Profit Target: 50% of $1.40 = $0.70. We aim to close the position if its value drops to $0.70 (meaning we buy it back for $0.70, realizing a $0.70 profit).
- Stop Loss: 1.5x credit = 1.5 * $1.40 = $2.10. We close if the position value rises to $1.40 + $2.10 = $3.50.
Trade Management & Outcome:
- August 26, 2022: Jerome Powell's hawkish Jackson Hole speech sends SPY tumbling. SPY closes around $405. The short 400 put is now much closer to the money, and its delta increases significantly (e.g., to -0.35). The overall value of our iron condor rises from $1.40 to approximately $2.50. We are still within our stop-loss, but monitoring closely.
- September 2, 2022: SPY continues its decline, trading around $395. The short 400 put is now in the money, and its delta is nearing -0.50. The value of our iron condor has risen to approximately $3.20. We are very close to our stop loss.
- September 6, 2022: SPY opens significantly lower, trading around $390. The value of our iron condor spikes to approximately $3.80. This exceeds our stop-loss of $3.50.
- Action: We immediately close the iron condor by buying it back for $3.80.
- Result:
- Initial Credit: $1.40
- Cost to Close: $3.80
- Net Loss: $1.40 - $3.80 = -$2.40, or -$240 per contract.
This example illustrates a losing trade, which is crucial for understanding iron condor historical performance. Even with good entry conditions (high IVR, high VIX), rapid directional moves can quickly turn a profitable setup into a significant loss. This is why robust stop-loss mechanisms and active monitoring are paramount. Our backtests consistently show that periods of high volatility, even when premiums are attractive, carry elevated risks for iron condors.
Had SPY remained within our range, or slowly drifted, we would have likely hit our 50% profit target within 20-30 days due to theta decay. For instance, if SPY had stayed between $410 and $430, the value of the condor might have decayed to $0.70 by mid-September, allowing us to close for a $70 profit per contract. This balanced perspective is what options backtesting provides – a realistic view of both wins and losses.
Risk Management: Mitigating the Iron Condor's Vulnerabilities
While the iron condor offers attractive probabilities of profit, its primary vulnerability lies in its exposure to large, unexpected directional moves. As our backtested example vividly demonstrates, even with favorable entry conditions, a sudden market shift can quickly turn a winning setup into a substantial loss. Effective risk management is not just a recommendation; it's the cornerstone of long-term success with iron condors.
Key Risk Management Strategies:
- Strict Stop-Loss Orders: This is non-negotiable. As seen, a loss can escalate rapidly. Define your maximum acceptable loss per trade (e.g., 1.5x or 2x the credit received) and adhere to it. For instance, if you collect $1.00 ($100) on a $10 wide spread, your maximum loss might be $150-$200. Our Volatility Anomaly platform emphasizes setting these parameters upfront.
- Position Sizing: Never allocate more than a small percentage of your total trading capital to a single iron condor. A common guideline is 1-3% of capital at risk per trade. If your account is $25,000 and your maximum loss on a single iron condor is $860 (as in our SPY example), this represents about 3.4% of your capital, which is at the higher end. For a $100,000 account, it's less than 1%. This prevents a single losing trade from significantly impairing your portfolio.
- Entry Filters (IVR & VIX): As our backtests show, initiating trades when IV Rank is high (e.g., >50-60%) and VIX is elevated (e.g., >20) provides a larger premium cushion. This doesn't eliminate risk, but it skews the odds slightly more in your favor by selling relatively expensive options. Avoid initiating iron condors in very low IV environments (IVR < 20%) as the collected premium may not adequately compensate for the risk.
- Diversification:
- Across Underlyings: Don't put all your capital into SPY. Consider iron condors on QQQ, IWM, or even highly liquid individual stocks like AAPL, GOOGL, or MSFT, provided they meet your IVR criteria.
- Across Expiration Cycles: Staggering expirations can smooth out returns and reduce the impact of a single event on your entire portfolio.
- Active Management & Adjustments:
- Delta-Based Stops: If a short strike's delta approaches 0.40 or 0.50, it indicates a high probability of being breached. This can be an earlier warning sign than a monetary stop loss.
- Rolling the Untouched Side: If one side of your condor is threatened (e.g., SPY drops towards your put spread), you might consider rolling the unchallenged call spread closer to the money (e.g., selling a lower strike call spread) to collect more credit and widen your breakeven point on the put side. However, backtests on rolling strategies are complex and often show mixed results; simple stop-loss is often more effective.
- Converting to a Broken Wing Butterfly: In extreme cases, if one side is breached, you might close the challenged spread for a loss and keep the unchallenged spread, effectively turning it into a broken wing butterfly or a credit spread, hoping for a mean reversion. This is an advanced technique and requires careful consideration.
- Early Exit for Profit: Don't be greedy. Our backtests confirm that taking smaller, consistent profits (e.g., 25-50% of max profit) often leads to better long-term results than holding for 75-90% of max profit, which exposes you to unnecessary gamma risk as expiration approaches.
- Avoid Earnings & Binary Events: Iron condors are generally not suitable for trading around earnings announcements or other known binary events due to the potential for massive price gaps and volatility crushes.
By integrating these risk management principles, traders can significantly improve the iron condor historical performance in their own portfolios, transforming it from a potentially volatile strategy into a more consistent income generator. Our Volatility Anomaly weekly picks and position monitoring tools are designed to help traders implement these strategies effectively.
Advanced Considerations: Beyond the Basic Iron Condor
For experienced options traders, the basic iron condor serves as a foundation. However, the strategy can be refined and adapted to specific market outlooks and volatility environments. These advanced considerations move beyond simple entry and exit rules, incorporating more nuanced market analysis and dynamic adjustments.
Skew and Implied Volatility Surface:
- Understanding Skew: The implied volatility of out-of-the-money (OTM) puts is typically higher than that of OTM calls for the same distance from the current price (known as "volatility skew"). This means you often collect more premium for selling an OTM put spread than an equidistant OTM call spread. Savvy traders can leverage this. Instead of perfectly balanced deltas (e.g., -0.16 put, +0.16 call), one might sell a -0.16 put and a +0.10 or +0.08 call to collect roughly equal premiums on both sides, effectively placing the call side further out.
- Volatility Smile/Smirk: The entire IV surface provides context. If the wings of your iron condor have significantly different IVs, it implies the market perceives a higher risk of breaching one side over the other. This can inform strike selection, perhaps by widening the spread on the higher IV side or adjusting deltas.
Asymmetrical Iron Condors:
Instead of equidistant strikes or balanced deltas, an asymmetrical iron condor positions the strikes based on a directional bias or perceived higher risk on one side.
- Bullish Bias: If you're moderately bullish, you might place your call spread further out (e.g., 0.05-0.10 delta calls) and your put spread closer (e.g., 0.20-0.25 delta puts). This collects more premium on the put side, giving you a wider profit zone to the upside, but increases the risk if the market drops sharply.
- Bearish Bias: Conversely, for a moderate bearish outlook, you'd place your put spread further out and your call spread closer.
- Wider Spread on One Side: If you perceive a higher tail risk on one side (e.g., a potential market crash), you might use a wider spread on the put side (e.g., $10 wide put spread) and a narrower spread on the call side (e.g., $5 wide call spread). This reduces the maximum loss on the higher-risk side, albeit at the cost of collecting less premium overall.
Iron Condors in Relation to VIX Futures Term Structure:
The VIX futures curve (term structure) provides insight into market expectations of future volatility.
- Contango (Upward Sloping): When VIX futures are in contango (front month < back months), it suggests a normal market environment where volatility is expected to decline over time. This is generally favorable for iron condors as it implies a decaying volatility premium.
- Backwardation (Downward Sloping): When VIX futures are in backwardation (front month > back months), it signals market stress and an expectation of higher near-term volatility. While premiums are high, initiating iron condors during backwardation is extremely risky, as the market is pricing in significant downside movement. Our options backtesting shows that iron condors initiated during periods of VIX backwardation often experience severe drawdowns.
Dynamic Strike Adjustments and "Iron Fly" Conversions:
- Rolling the Untouched Side: As mentioned in risk management, if one side of your iron condor is challenged (e.g., SPY drops towards your put spread), you can often roll the unchallenged side (the call spread) closer to the money to collect more credit. For example, if your short 440 call is now far out of the money with a 0.05 delta, you might buy it back and sell a 430 call, collecting more premium. This helps offset losses on the challenged side or increases your overall credit.
- Converting to an Iron Butterfly: If the underlying moves significantly and breaches one of your short strikes, you might consider closing the out-of-the-money spread for a small profit or loss and then adjusting the remaining credit spread into an iron butterfly centered around the new price. This is a highly advanced maneuver, often used by professional traders to defend positions and requires precise execution.
These advanced techniques require a deeper understanding of options greeks, market structure, and active management. While they offer potential for enhanced returns and better risk mitigation, they also introduce complexity. For most traders, mastering the fundamentals and strict risk management, as revealed by our iron condor backtest, is the most prudent path to consistent profitability.
Conclusion & Key Takeaways
Our deep dive into iron condor backtest data reveals a nuanced picture. While the strategy holds significant appeal for its high probability of profit and income-generating potential, its iron condor historical performance is far from a guaranteed path to riches. Success is intricately tied to precise entry conditions, disciplined risk management, and an acute awareness of prevailing market volatility. The data unequivocally demonstrates that a "set it and forget it" approach is a recipe for disaster, especially during periods of elevated market stress.
At Volatility Anomaly, our commitment is to provide traders with the empirical evidence needed to make informed decisions. Options backtesting is not just an academic exercise; it's a vital tool for understanding the true risk-reward profile of any strategy. By embracing a data-driven approach, you can refine your iron condor methodology, turning it into a more robust and reliable component of your trading arsenal.
Key Takeaways for Iron Condor Trading:
- Entry Conditions are Paramount: Initiate iron condors when IV Rank is high (e.g., >50%) and VIX is elevated (e.g., >20). This provides a larger premium buffer against adverse moves.
- Win Rate ≠ Profitability: High win rates are common, but a few large losses can erase many small wins. Focus on risk-adjusted returns and manage your losing trades aggressively.
- Strict Risk Management is Essential: Implement non-negotiable stop-loss orders (e.g., 1.5x-2x credit received) and adhere to prudent position sizing (1-3% of capital at risk per trade).
- Market Regimes Matter: Iron condors generally perform best in sideways or slowly trending markets with stable or declining volatility. They struggle significantly in sharp, directional, high-volatility environments.
- Take Profits Early: Aim for 25-50% of maximum profit. Holding for higher percentages exposes you to unnecessary gamma risk and increases the chance of a winning trade turning into a loser.
- Actively Monitor & Adjust: Don't leave trades unmonitored. Be prepared to adjust strikes or close positions based on delta thresholds (e.g., if a short strike delta reaches 0.40) or market conditions.
- Diversify: Spread your capital across different liquid underlyings (SPY, QQQ, AAPL, etc.) and expiration cycles to mitigate single-asset or single-event risk.
#VolatilityAnomaly · #IVRank · #OptionsTrading · #VRP
You Might Also Like
Volatility Anomaly
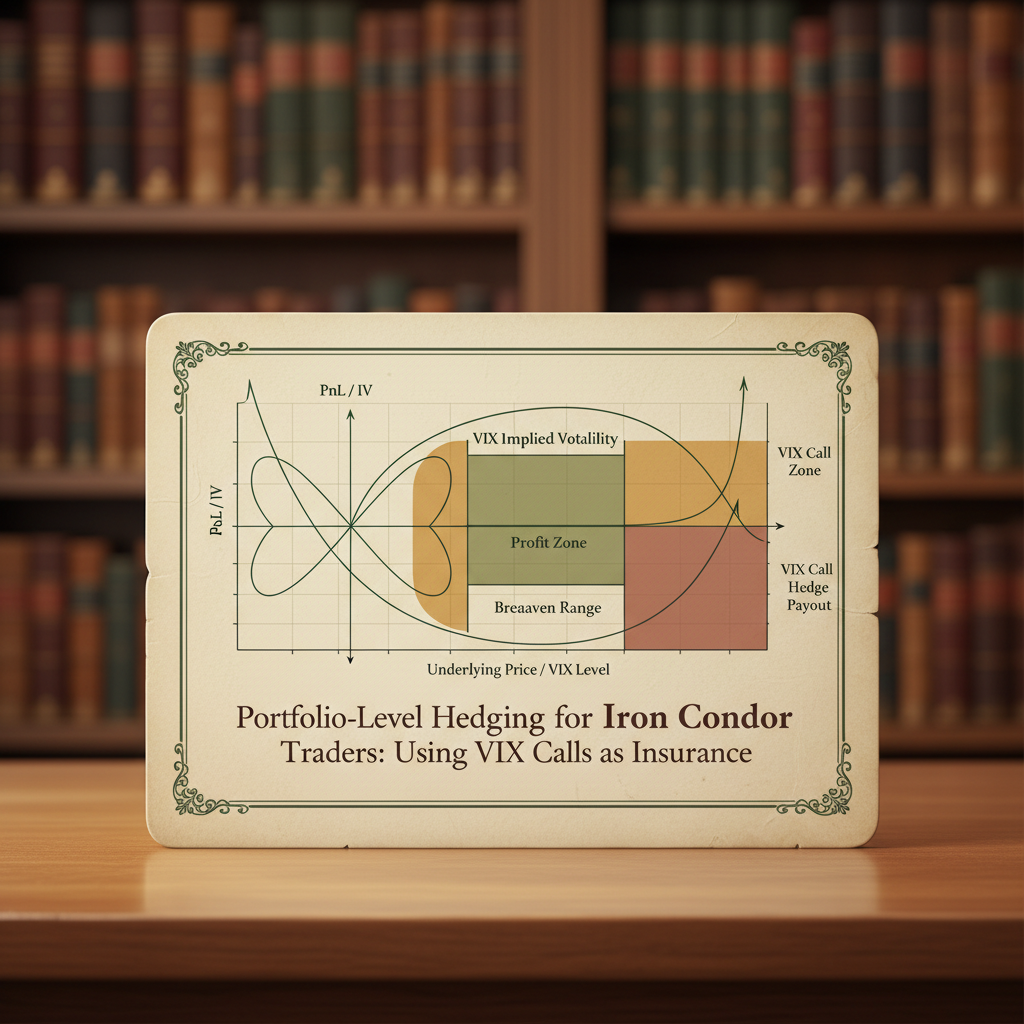
Portfolio-Level Hedging for Iron Condor Traders: Using VIX Calls as Insurance
Portfolio-Level Hedging for Iron Condor Traders: Using VIX Calls as Insurance Portfolio-Level Hedging for Iron Condor Traders: Using VIX Calls as Insurance In the world of options trading, strategies like the Iron Condor are highly popular for their ability to generate consistent
Jan 1970
Volatility Anomaly
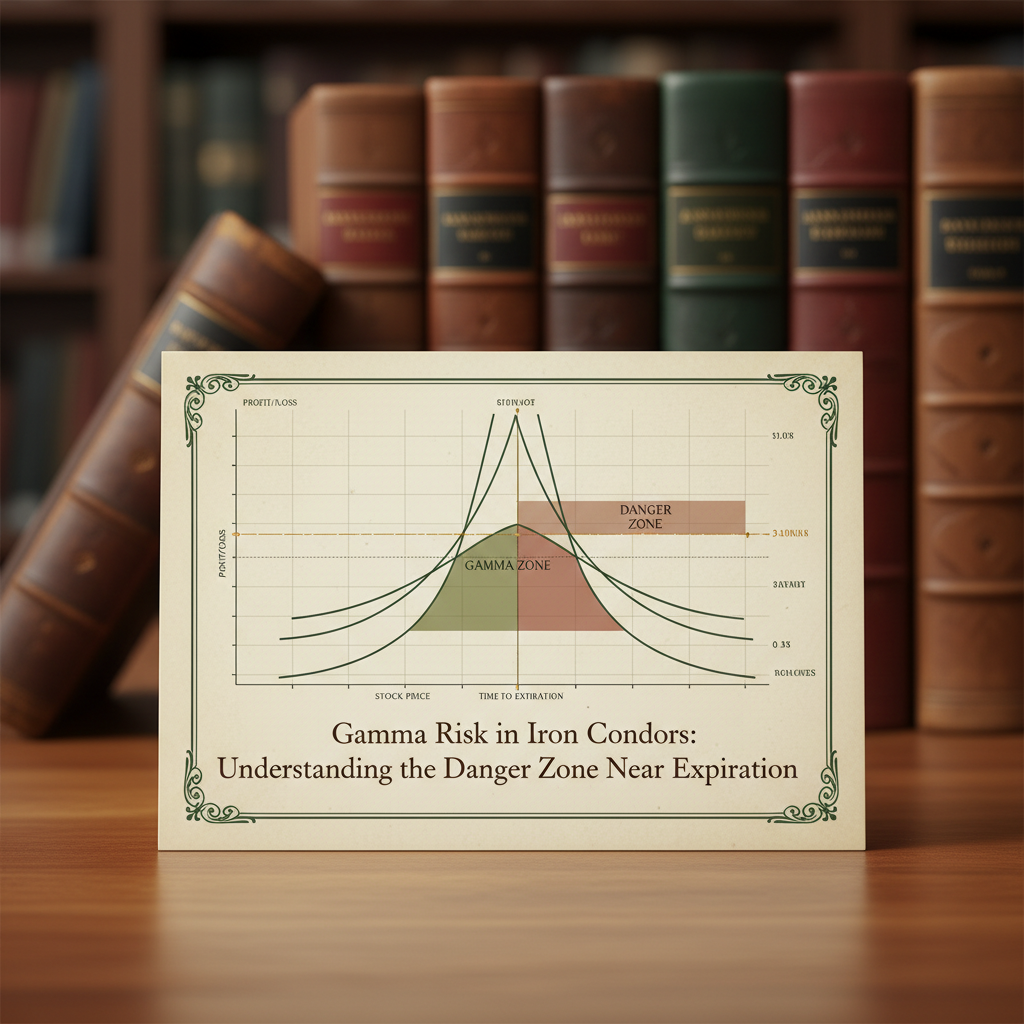
Gamma Risk in Iron Condors: Understanding the Danger Zone Near Expiration
Gamma Risk in Iron Condors: Understanding the Danger Zone Near Expiration As options traders, we often seek strategies that offer defined risk and a high probability of profit. The iron condor, a staple in many portfolios, perfectly embodies this philosophy. By selling out-of-the
Jan 1970
YOU MIGHT ALSO LIKE
Portfolio-Level Hedging for Iron Condor Traders: Using VIX Calls as Insurance
Portfolio-Level Hedging for Iron Condor Traders: Using VIX Calls as Insurance Portfolio-Level Hedging for Iron…
Read articleGamma Risk in Iron Condors: Understanding the Danger Zone Near Expiration
Gamma Risk in Iron Condors: Understanding the Danger Zone Near Expiration As options traders, we often seek st…
Read articleThe 50% Profit Target Rule: Why Closing Early Improves Your Long-Term Returns
The 50% Profit Target Rule: Why Closing Early Improves Your Long-Term Returns In the dynamic world of options…
Read articleThis article is for educational purposes only and does not constitute financial or investment advice. Options trading involves significant risk of loss and is not suitable for all investors. Past performance is not indicative of future results.