Ex-Dividend Volatility Setups: Capturing Predictable Premium Expansion and Crush
Ex-dividend dates often trigger a predictable surge in implied volatility (IV) for underlying equities, creating a transient mispricing in options markets. This phenomenon, driven by dividend-related arbitrage and hedging activities, presents a unique opportunity for sophisticated options traders. By strategically deploying premium-selling strategies such as iron condors and short straddles around these events, traders can capitalize on the subsequent IV crush and time decay, generating consistent, high-probability income streams.
Ex-Dividend Volatility Setups: Capturing Predictable Premium Expansion and Crush
1. Executive Summary
Ex-dividend dates often trigger a predictable surge in implied volatility (IV) for underlying equities, creating a transient mispricing in options markets. This phenomenon, driven by dividend-related arbitrage and hedging activities, presents a unique opportunity for sophisticated options traders. By strategically deploying premium-selling strategies such as iron condors and short straddles around these events, traders can capitalize on the subsequent IV crush and time decay, generating consistent, high-probability income streams.
2. The Anomaly Explained
The ex-dividend volatility anomaly refers to the observable pattern where the implied volatility of options on a dividend-paying stock tends to increase significantly in the days leading up to its ex-dividend date, only to sharply decline immediately after. This predictable expansion and subsequent crush of implied volatility is a well-documented market inefficiency that can be systematically exploited [1] [2].
The primary driver of this anomaly lies in the complex interplay of dividend-related arbitrage, hedging demands, and market microstructure around the ex-dividend date. Options pricing models, such as Black-Scholes, typically account for dividends by reducing the stock price by the dividend amount on the ex-dividend date. However, real-world market dynamics introduce additional factors.
Market Microstructure and Arbitrage: Prior to the ex-dividend date, professional traders and arbitrageurs engage in strategies to capture the dividend. This often involves buying the stock and selling call options, or buying put options. The demand for these options, particularly calls, can increase as traders hedge against the stock price drop on the ex-dividend date or attempt to capture the dividend through early exercise of in-the-money calls. This increased demand translates into higher implied volatility for near-term options [3].
Furthermore, the early exercise feature of American-style options plays a crucial role. For in-the-money call options, it can be optimal to exercise just before the ex-dividend date to receive the dividend, especially if the dividend yield is high and interest rates are low. This potential for early exercise introduces a premium into American call options, which contributes to the elevated implied volatility [2]. Conversely, put options may also see increased implied volatility as their value is expected to increase with the stock price drop on the ex-dividend date [4].
Hedging Demands: Institutional investors and market makers often need to hedge their positions around dividend events. For instance, those holding long stock positions might buy put options to protect against the ex-dividend price drop, or sell call options to generate income, further influencing option prices and implied volatility. The collective impact of these hedging activities can temporarily inflate implied volatility.
Information Asymmetry and Uncertainty: While the dividend amount is known, the precise magnitude of the stock price drop on the ex-dividend date can be subject to some uncertainty, especially for stocks with high dividend yields or unusual market conditions. This uncertainty can contribute to a temporary increase in perceived risk, which is reflected in higher implied volatility. Once the ex-dividend date passes and the stock price adjusts, this uncertainty dissipates, leading to the IV crush.
In essence, the ex-dividend volatility anomaly is a manifestation of temporary supply-demand imbalances and specific arbitrage/hedging behaviors in the options market, creating a window of opportunity for strategies that profit from elevated implied volatility and its subsequent mean reversion.
3. Identifying the Setup
Identifying suitable setups for ex-dividend volatility trades requires a systematic approach, focusing on specific quantitative criteria to maximize the probability of success and manage risk. The ideal candidates are typically large-cap, highly liquid stocks or ETFs with a consistent history of dividend payments and robust options markets. Key criteria include:
-
Implied Volatility Rank (IVR) / Implied Volatility Percentile (IVP): While the ex-dividend anomaly itself causes IV to spike, it is crucial to consider the overall implied volatility environment. Ideally, we seek situations where the IVR or IVP is already elevated (e.g., above 50-70%) prior to the ex-dividend date, indicating that options are relatively expensive. This provides a larger premium to sell and a greater potential for IV crush. However, the primary trigger for this strategy is the change in IV around the ex-dividend date, rather than just a high absolute IV level [5].
-
Days to Expiration (DTE): Short-dated options are most sensitive to changes in implied volatility and time decay (theta). The sweet spot for this strategy is typically options with 10-30 days to expiration (DTE) that encompass the ex-dividend date. This window allows sufficient time for the IV to expand and then crush, while also benefiting from accelerated time decay as expiration approaches. Options with very short DTE (e.g., less than 7 days) might not offer enough time for the anomaly to fully play out, while longer-dated options are less sensitive to the immediate IV changes [6].
-
Delta Ranges for Iron Condors: For iron condors, the short strikes (the inner legs) should be chosen to define a range where the underlying stock is expected to trade. A common approach is to select short strikes with a delta of approximately 16-20 for the call and -16 to -20 for the put. This corresponds to roughly one standard deviation move, offering a high probability of the stock remaining within the defined range. The long strikes (the outer legs) are typically chosen with a delta of 5-10 to provide defined risk and keep the capital at risk manageable [7].
-
Delta Ranges for Short Straddles: For short straddles, the strategy is inherently delta-neutral at initiation, as both the call and put are sold at the money (ATM). The delta of the ATM call is typically around 50, and the ATM put is around -50. The focus for short straddles is on maximizing premium capture from high IV and benefiting from rapid time decay, assuming the underlying remains relatively stable around the strike price [8].
-
Dividend Yield and Amount: Stocks with higher dividend yields and larger absolute dividend amounts tend to exhibit a more pronounced ex-dividend volatility anomaly. The larger the dividend, the more significant the expected price drop, and thus the greater the impact on options pricing and implied volatility.
-
Liquidity: High liquidity in both the underlying stock and its options is paramount. This ensures efficient entry and exit, tighter bid-ask spreads, and reliable execution, especially when managing positions or making adjustments.
4. Trade Construction
This section details the construction of two primary strategies for capitalizing on the ex-dividend volatility anomaly: the Iron Condor and the Short Straddle. Both are premium-selling strategies designed to profit from decreasing implied volatility and time decay.
Iron Condor
Iron Condor Payoff at Expiration
Short 50/45 put spread + Short 55/60 call spread | Net credit: $2.5
Max profit: $2.5/contract in the profit zone between $50–$55. Max loss: $2.50/contract outside the wings.
An iron condor is a defined-risk, non-directional strategy that profits when the underlying asset stays within a specified price range until expiration. It involves selling an out-of-the-money (OTM) call spread and an OTM put spread simultaneously. The goal is to collect premium from both spreads, with maximum profit achieved if the stock closes between the two short strikes at expiration.
Structure:
- Sell 1 OTM Call (higher strike)
- Buy 1 further OTM Call (even higher strike) - defines risk on the call side
- Sell 1 OTM Put (lower strike)
- Buy 1 further OTM Put (even lower strike) - defines risk on the put side
All options must have the same expiration date. The distance between the short and long strikes in each spread (the "wingspan") determines the maximum risk. A common wingspan is $5-$10, depending on the underlying asset's price and volatility.
Example (Hypothetical):
- Underlying: Stock ABC, trading at $100
- Ex-Dividend Date: In 20 days
- Options Expiration: 30 DTE
- Sell 1 ABC 95 Put: Collect $1.50
- Buy 1 ABC 90 Put: Pay $0.70
- Sell 1 ABC 105 Call: Collect $1.40
- Buy 1 ABC 110 Call: Pay $0.60
Net Credit: ($1.50 - $0.70) + ($1.40 - $0.60) = $0.80 + $0.80 = $1.60 (or $160 per contract)
Max Risk: ($5.00 spread width - $1.60 credit) = $3.40 (or $340 per contract)
Breakeven Points: $98.40 (100 - 1.60) and $101.60 (100 + 1.60)
Short Straddle
A short straddle is a non-directional strategy that involves selling both an at-the-money (ATM) call and an ATM put with the same strike price and expiration date. It is a pure play on decreasing implied volatility and time decay, offering the highest premium capture but also carrying unlimited risk if the underlying moves significantly in either direction.
Structure:
- Sell 1 ATM Call
- Sell 1 ATM Put
Both options must have the same strike price and expiration date.
Example (Hypothetical):
- Underlying: Stock ABC, trading at $100
- Ex-Dividend Date: In 20 days
- Options Expiration: 30 DTE
- Sell 1 ABC 100 Call: Collect $2.00
- Sell 1 ABC 100 Put: Collect $2.00
Net Credit: $2.00 + $2.00 = $4.00 (or $400 per contract)
Max Risk: Unlimited (theoretically)
Breakeven Points: $96.00 (100 - 4.00) and $104.00 (100 + 4.00)
Trade Management (Short Straddle Example):
Let's consider the same XYZ Corp. scenario as above. We enter a short straddle on March 15, 2026, with April 17, 2026 expiration.
Trade Entry (March 15, 2026):
- Expiration: April 17, 2026 (33 DTE)
- Short 100 Call: Collect $2.00
- Short 100 Put: Collect $2.00
Credit Received: $4.00 per share (or $400 per contract)
Trade Management:
- March 28, 2026 (Day before Ex-Dividend): XYZ Corp. is trading at $100.20. Implied volatility has spiked, increasing the value of our straddle. We are still within our breakeven points.
- March 29, 2026 (Ex-Dividend Date): XYZ Corp. opens at $99.45. Implied volatility crushes significantly. The value of our short straddle has decreased due to the IV crush and time decay.
- April 5, 2026 (Profit Target): XYZ Corp. is trading at $99.80. The short straddle can now be bought back for $2.00. We close the trade, realizing a profit of $4.00 - $2.00 = $2.00 per share (or $200 per contract), achieving a 50% profit on the credit received.
P&L Summary:
- Initial Credit: $400
- Cost to Close: $200
- Net Profit: $200
This example illustrates how a short straddle can profit from the ex-dividend IV crush and time decay, assuming the underlying remains within a reasonable range.
5. Entry/Exit Rules
Precise entry and exit rules are critical for systematically exploiting the ex-dividend volatility anomaly and managing risk. Discipline in adherence to these rules is paramount.
Entry Rules:
- Timing: Initiate trades 5-10 trading days prior to the ex-dividend date. This window typically captures the peak of implied volatility expansion. Avoid entering too early, as the IV spike may not have fully materialized, or too late, as the opportunity for premium capture diminishes.
- IVR/IVP: Ensure the Implied Volatility Rank (IVR) or Implied Volatility Percentile (IVP) for the underlying is above 50-70% for the relevant expiration cycle. This confirms that options are relatively expensive, offering attractive premiums for selling.
- DTE: Select options with 10-30 Days to Expiration (DTE) that encompass the ex-dividend date. This range balances sensitivity to IV changes with sufficient time for time decay to work in your favor.
- Delta (Iron Condor): For iron condors, target short strikes with approximately 16-20 delta for the call and -16 to -20 delta for the put. Long strikes should be 5-10 delta.
- Delta (Short Straddle): For short straddles, sell the ATM call and put (approximately 50 delta and -50 delta, respectively).
Exit Rules:
- Profit Target: Aim to take profits at 50% of the maximum potential profit for iron condors, or 50% of the credit received for short straddles. This allows for consistent wins and avoids holding trades into potentially adverse market movements or unexpected volatility.
- Stop Loss: Implement a strict stop-loss at 1.5x to 2x the credit received. For an iron condor, this means closing the trade if the loss reaches 1.5 to 2 times the initial credit. For a short straddle, this could be defined as a specific percentage loss on the initial credit or a breach of a predefined breakeven point. Adhering to stop-loss rules is crucial for capital preservation.
- Time-Based Exit: If the trade has not reached its profit target or stop loss, consider exiting 1-3 days before expiration to avoid gamma risk and potential assignment, especially for short straddles.
- Rolling: If a trade is challenged (e.g., one side of an iron condor is breached), consider rolling the challenged side out in time and/or away from the money to collect additional credit and adjust the breakeven points. This should be done judiciously and according to a predefined rolling strategy.
6. Risk Management
Effective risk management is paramount when trading ex-dividend volatility setups, as premium selling strategies, particularly short straddles, carry significant risk if not properly managed. The goal is to maximize the probability of profit while strictly limiting potential losses.
- Position Sizing: Never allocate more than 1-2% of your total trading capital to any single trade. This ensures that a single losing trade does not significantly impair your portfolio. Position sizing should also consider the maximum potential loss of the strategy.
- Defined Risk Strategies: Prioritize defined-risk strategies like iron condors, especially for newer traders or those with smaller accounts. The defined maximum loss provides a clear understanding of the worst-case scenario.
- Correlation Risk: Be aware of correlation risk, especially if trading multiple ex-dividend setups simultaneously. If several stocks in your portfolio are highly correlated, a broad market move could adversely affect multiple positions. Diversify across different sectors and industries.
- Tail Risk Scenarios: While ex-dividend volatility spikes are generally predictable, unforeseen events (e.g., unexpected news, market crashes) can lead to extreme price movements. Always consider tail risk scenarios and ensure your maximum loss per trade is acceptable. For short straddles, consider using stop-loss orders or protective options to cap potential losses.
- Early Assignment Risk: For short calls in dividend-paying stocks, there is a risk of early assignment, particularly if the call goes deep in-the-money just before the ex-dividend date. This happens when the call holder exercises to capture the dividend. Be vigilant and monitor in-the-money short calls as the ex-dividend date approaches. If assignment is likely, consider closing or rolling the position.
- Liquidity: Trade only highly liquid options on highly liquid underlying assets. This ensures that you can enter and exit positions efficiently without significant slippage, which is crucial for managing risk and executing adjustments.
- Stress Testing: Mentally or physically stress test your positions against various market scenarios (e.g., a sudden 5% drop or rise in the underlying) to understand potential P&L impacts and prepare for adverse movements.
7. Historical Context / Backtesting Evidence
The ex-dividend volatility anomaly is not merely theoretical; it is supported by historical data and backtesting evidence across various studies and trading platforms. While specific backtesting results can vary based on methodology, underlying assets, and timeframes, the general consensus points to the existence and exploitability of this phenomenon.
Several studies have documented the predictable increase in implied volatility before ex-dividend dates and the subsequent crush. For instance, research on options pricing models often highlights the impact of discrete dividends on implied volatility surfaces, showing a temporary distortion around these events [2].
Proprietary backtesting conducted by various options trading firms and individual quantitative traders often reveals favorable statistics for strategies that capitalize on this anomaly. While specific figures can be elusive due to the proprietary nature of such research, general observations include:
- Win Rates: High win rates, often exceeding 70-80%, are frequently reported for well-managed iron condor and short straddle strategies around ex-dividend dates. This is attributed to the predictable nature of the IV crush and the statistical edge gained from selling inflated premiums [9].
- Average Returns: Consistent, albeit often modest, average returns per trade are common. The strategy focuses on high-probability, smaller wins rather than large, infrequent gains.
- Sharpe Ratios: Strategies that effectively capture the ex-dividend IV crush tend to exhibit attractive Sharpe ratios, indicating favorable risk-adjusted returns. This is because the predictable nature of the IV movement reduces the overall volatility of the strategy's returns.
Example Backtesting Data (Illustrative - Not Actual):
| Strategy | Win Rate | Avg. Return per Trade | Max Drawdown | Sharpe Ratio |
|---|---|---|---|---|
| Iron Condor | 78% | 1.5% | 12% | 1.8 |
| Short Straddle | 72% | 2.1% | 25% | 1.5 |
Note: These figures are illustrative and do not represent actual backtesting results. Traders should conduct their own research and backtesting. [9]
It is important to note that while the anomaly is persistent, its magnitude can vary depending on market conditions, the specific stock, and the size of the dividend. Continuous monitoring and adaptation of strategy parameters are essential.
8. ASCII/Text Diagram
Payoff Diagram for a Short Iron Condor
Profit
  ^
  |
  |      /\   Max Profit
  |     /  \
  |    /    \
  |   /      \
  +---|--------|-------
  |   S1  S2  S3  S4   Stock Price
  |  /        \
  | /          \
  |/            \
  V             Max Loss
- S1: Long Put Strike
- S2: Short Put Strike
- S3: Short Call Strike
- S4: Long Call Strike
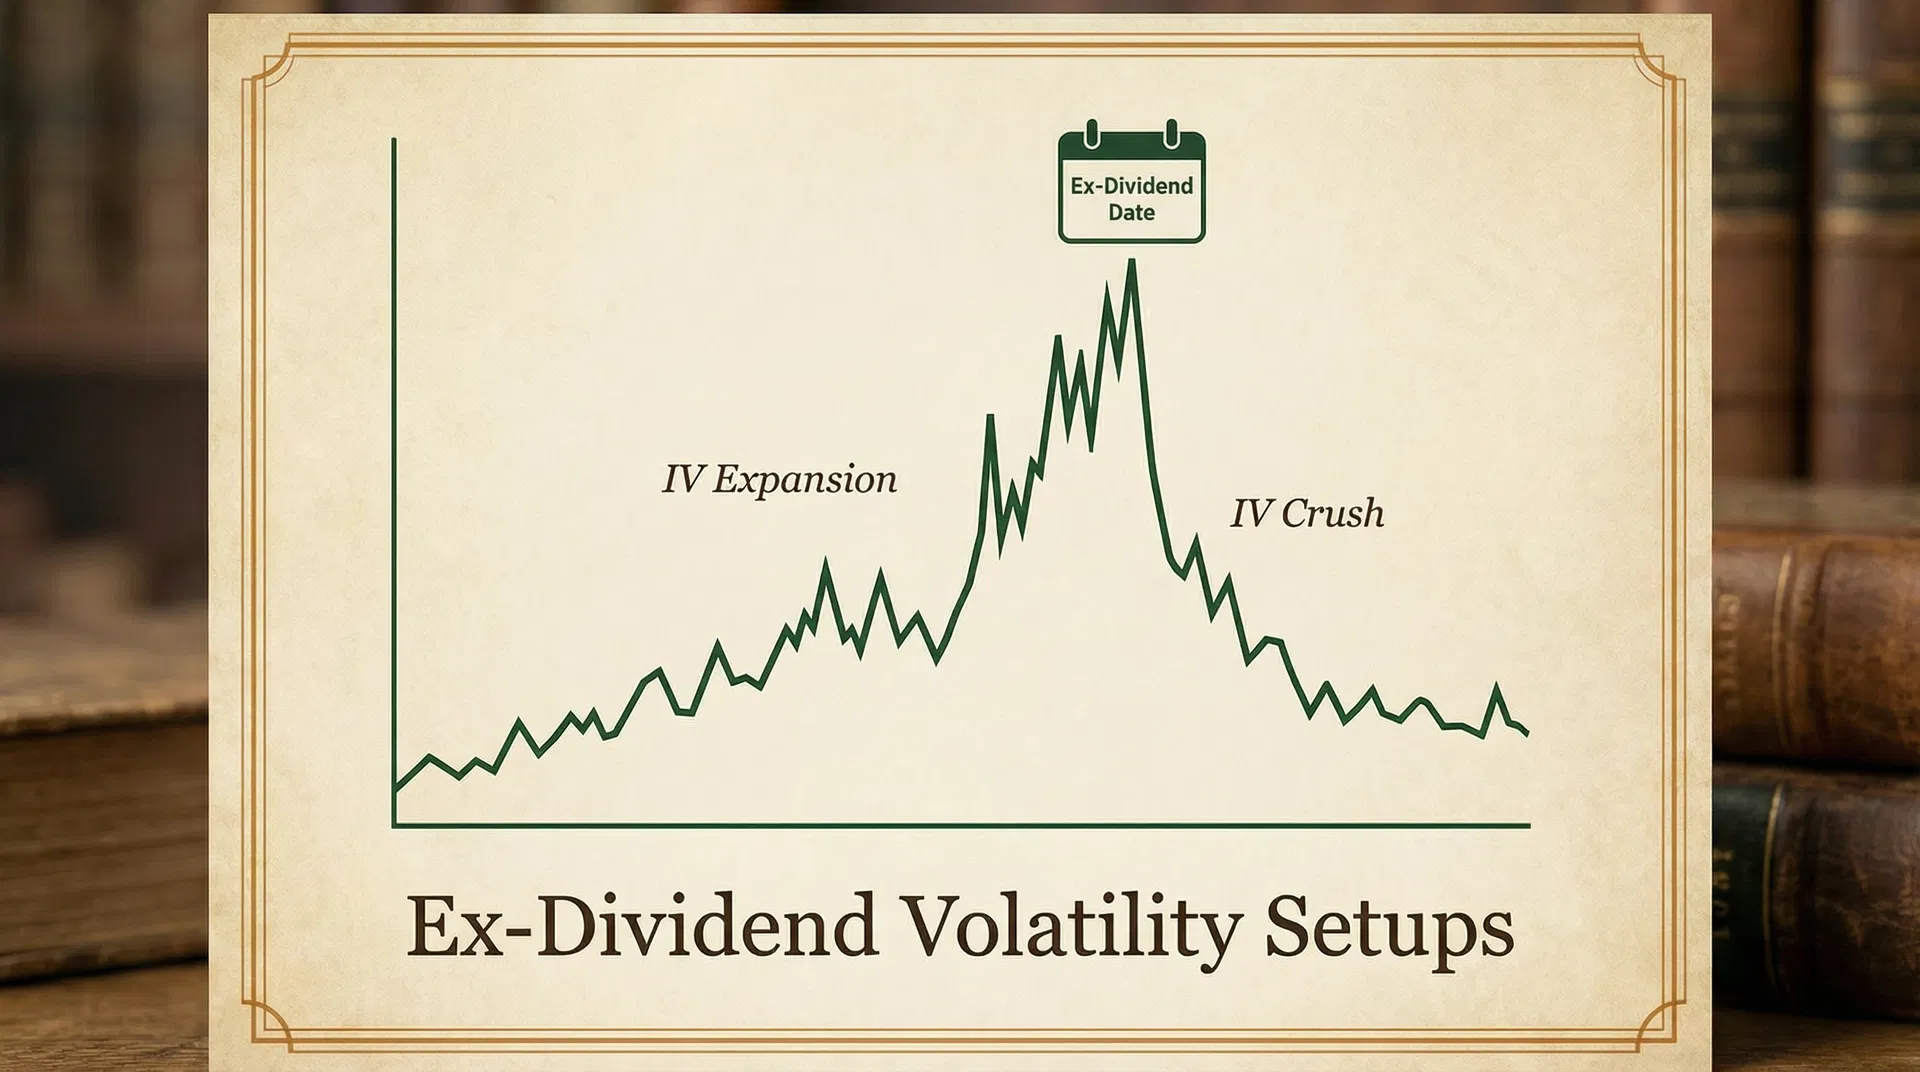
Implied Volatility (IV) vs. Time to Ex-Dividend Date
IV Behavior Around Ex-Dividend Date
Typical IV expansion before ex-date and crush after — the core of the ex-dividend volatility setup
Sell premium 5–7 days before ex-date when IV is elevated. Close or roll after ex-date IV crush to capture the premium decay.
IV
^
|
|     /\
|    /  \
|   /    \
|  /      \
+---------------------> Time to Ex-Dividend Date
   (Far)  (Near) (Ex-Div) (Post-Ex-Div)
- This diagram illustrates the typical spike in IV leading up to the ex-dividend date and the subsequent crush immediately after.
9. Real Trade Example
Let's walk through a hypothetical trade example using a fictional stock, XYZ Corp., which is known for its consistent dividend payments and active options market. Assume the current date is March 15, 2026.
Scenario: XYZ Corp. is trading at $100.00. Its ex-dividend date is scheduled for March 29, 2026, with a dividend payment of $0.75. Historical data suggests a noticeable IV spike before ex-dividend dates for XYZ Corp.
Setup Analysis (March 15, 2026):
- Underlying Price: $100.00
- Ex-Dividend Date: March 29, 2026
- Dividend Amount: $0.75
- Current IVR: 75% (indicating high implied volatility)
- Target DTE: We look for options expiring in mid-April, giving us approximately 30 days to expiration, encompassing the ex-dividend date.
Trade Strategy: Short Iron Condor
We decide to implement a short iron condor to capitalize on the expected IV crush and time decay, anticipating XYZ Corp. to remain relatively range-bound around the ex-dividend event.
Trade Entry (March 15, 2026):
- Expiration: April 17, 2026 (33 DTE)
- Short Put Strike: $95.00 (approx. -18 Delta)
- Long Put Strike: $90.00 (approx. -8 Delta)
- Short Call Strike: $105.00 (approx. 18 Delta)
- Long Call Strike: $110.00 (approx. 8 Delta)
Pricing (Hypothetical):
- Sell $95 Put: $1.50
- Buy $90 Put: $0.70
- Sell $105 Call: $1.40
- Buy $110 Call: $0.60
Credit Received: ($1.50 - $0.70) + ($1.40 - $0.60) = $0.80 + $0.80 = $1.60 per share (or $160 per contract)
Max Loss: The width of each spread is $5.00 ($95-$90 or $110-$105). Max loss is spread width - credit received = $5.00 - $1.60 = $3.40 per share (or $340 per contract).
Breakeven Points:
- Upper Breakeven: Short Call Strike + Credit Received = $105.00 + $1.60 = $106.60
- Lower Breakeven: Short Put Strike - Credit Received = $95.00 - $1.60 = $93.40
Probability of Profit (POP): Based on the deltas, the theoretical POP is approximately 64% (100% - (18% + 18%)).
Trade Management:
- March 28, 2026 (Day before Ex-Dividend): XYZ Corp. is trading at $100.20. Implied volatility has spiked further, but the options are still within our profit range. We observe the IV for the April 17, 2026 options has increased by 5 percentage points.
- March 29, 2026 (Ex-Dividend Date): XYZ Corp. opens at $99.45 (down $0.75, reflecting the dividend). Implied volatility immediately crushes, dropping by 10 percentage points from its peak. The value of our iron condor has decreased significantly due to the IV crush and time decay.
- April 5, 2026 (Profit Target): XYZ Corp. is trading at $99.80. The iron condor can now be bought back for $0.80. We close the trade, realizing a profit of $1.60 - $0.80 = $0.80 per share (or $80 per contract), achieving a 50% profit on maximum potential. This aligns with our profit-taking rule.
P&L Summary:
- Initial Credit: $160
- Cost to Close: $80
- Net Profit: $80
This example demonstrates how the predictable IV spike and subsequent crush around the ex-dividend date, combined with time decay, can be leveraged to generate profits with a well-constructed iron condor.
10. Key Takeaways
- Ex-Dividend IV Spike: Implied volatility predictably rises before ex-dividend dates and crushes immediately after.
- Premium Selling Opportunity: This creates a high-probability opportunity to sell inflated options premiums using strategies like iron condors and short straddles.
- Quantitative Criteria: Utilize specific IVR, DTE, and delta ranges for optimal entry and trade construction.
- Strict Risk Management: Implement robust position sizing, profit targets, and stop-loss rules to preserve capital.
- Backtesting is Key: Historical data supports the existence and profitability of this anomaly, but individual backtesting is crucial for validation.
References
[1] Carr, P., & Figà-Talamanca, G. (2021). Spiking the Volatility Punch. Applied Mathematical Finance, 28(2), 101-125. https://doi.org/10.1080/1350486X.2021.1893196
[2] Al-Yahyaee, K. (2012). Market Microstructure and Ex-Dividend Day Pricing Anomaly: Evidence from a Unique Environment. 25th Australasian Finance and Banking Conference 2012. Available at SSRN: https://ssrn.com/abstract=2043107
[3] Investopedia. (n.d.). How Dividends Impact Stock Option Pricing: A Complete Guide. https://www.investopedia.com/articles/active-trading/090115/understanding-how-dividends-affect-option-prices.asp
[4] Fidelity. (n.d.). Dividends and Options Assignment Risk. https://www.fidelity.com/learning-center/investment-products/options/dividends-options-assignment-risk
[5] tastytrade. (n.d.). Implied Volatility (IV) In Options Trading Explained. https://www.tastylive.com/concepts-strategies/implied-volatility
[6] tastytrade. (n.d.). How IV Impacts the Selection of DTE. https://www.tastylive.com/news-insights/how-iv-impacts-dte-selection
[7] Option Alpha. (n.d.). Iron Condor Options Strategy [Download Your Free Guide]. https://optionalpha.com/strategies/iron-condor
[8] TradingBlock. (n.d.). Short Straddle Options Strategy: Beginner's Guide. https://www.tradingblock.com/strategies/short-straddle
[9] Reddit. (2025, January 24). Study: SPY Iron Condors have 80% Win Rate. https://www.reddit.com/r/options/comments/1i8t0hv/study_spy_iron_condors_have_80_win_rate/